Content Velocity Benchmarks by Company Stage and Team Size
Avoid misreading velocity—what actually matters are growth stage and team size.

Content velocity is one of the most misread metrics in marketing. Teams treat it as a post count, benchmark themselves against peers, and miss the two variables that actually determine what's achievable: growth stage and team size. That misread produces either false confidence or misdirected effort, sometimes both at once.
Before any benchmark means anything, velocity needs a working definition. It is not the size of your content library. Publishing every Tuesday is not, by itself, a strategy. Real velocity operates across three dimensions simultaneously: how fast ideas move from conception to publication, how many topics your program is actively covering, and what quality floor each asset must clear before it goes live. Pull any one of those out of proportion and the whole thing breaks. Twenty thin pieces a month that no reader would save is not a high-velocity content operation. Neither is a rich archive that stopped publishing substantively two quarters ago.
The reason one number cannot serve every company is that the strategic purpose of content shifts fundamentally at each stage. Pre-seed, you are proving product-market fit with a narrow audience. Series A and B, you are expanding reach into adjacent segments. Series C and enterprise, you are defending category leadership across geographies, product lines, and audiences you have not fully mapped yet. Each of those goals demands a different output strategy. The frequency that earns deep trust at seed would represent gross under-investment at Series B. The volume required for category dominance at enterprise would collapse a seed-stage team before it built anything worth keeping.
Resources compound this divergence. Headcount, budget, and tooling scale unevenly, and they don't wait for strategy to catch up. A seed-stage team chasing enterprise output rates will sacrifice depth for volume and erode the trust-building that is the only thing that matters early on. An enterprise team holding itself to startup benchmarks will under-invest in coverage precisely when competitive stakes are highest. Growth stage sets the strategic priority. Team size sets the capacity ceiling. What follows maps those combinations across the stages where the benchmarks diverge most sharply.
Pre-Seed and Seed Stage: Four to Eight Pieces Per Month as the Quality Anchor
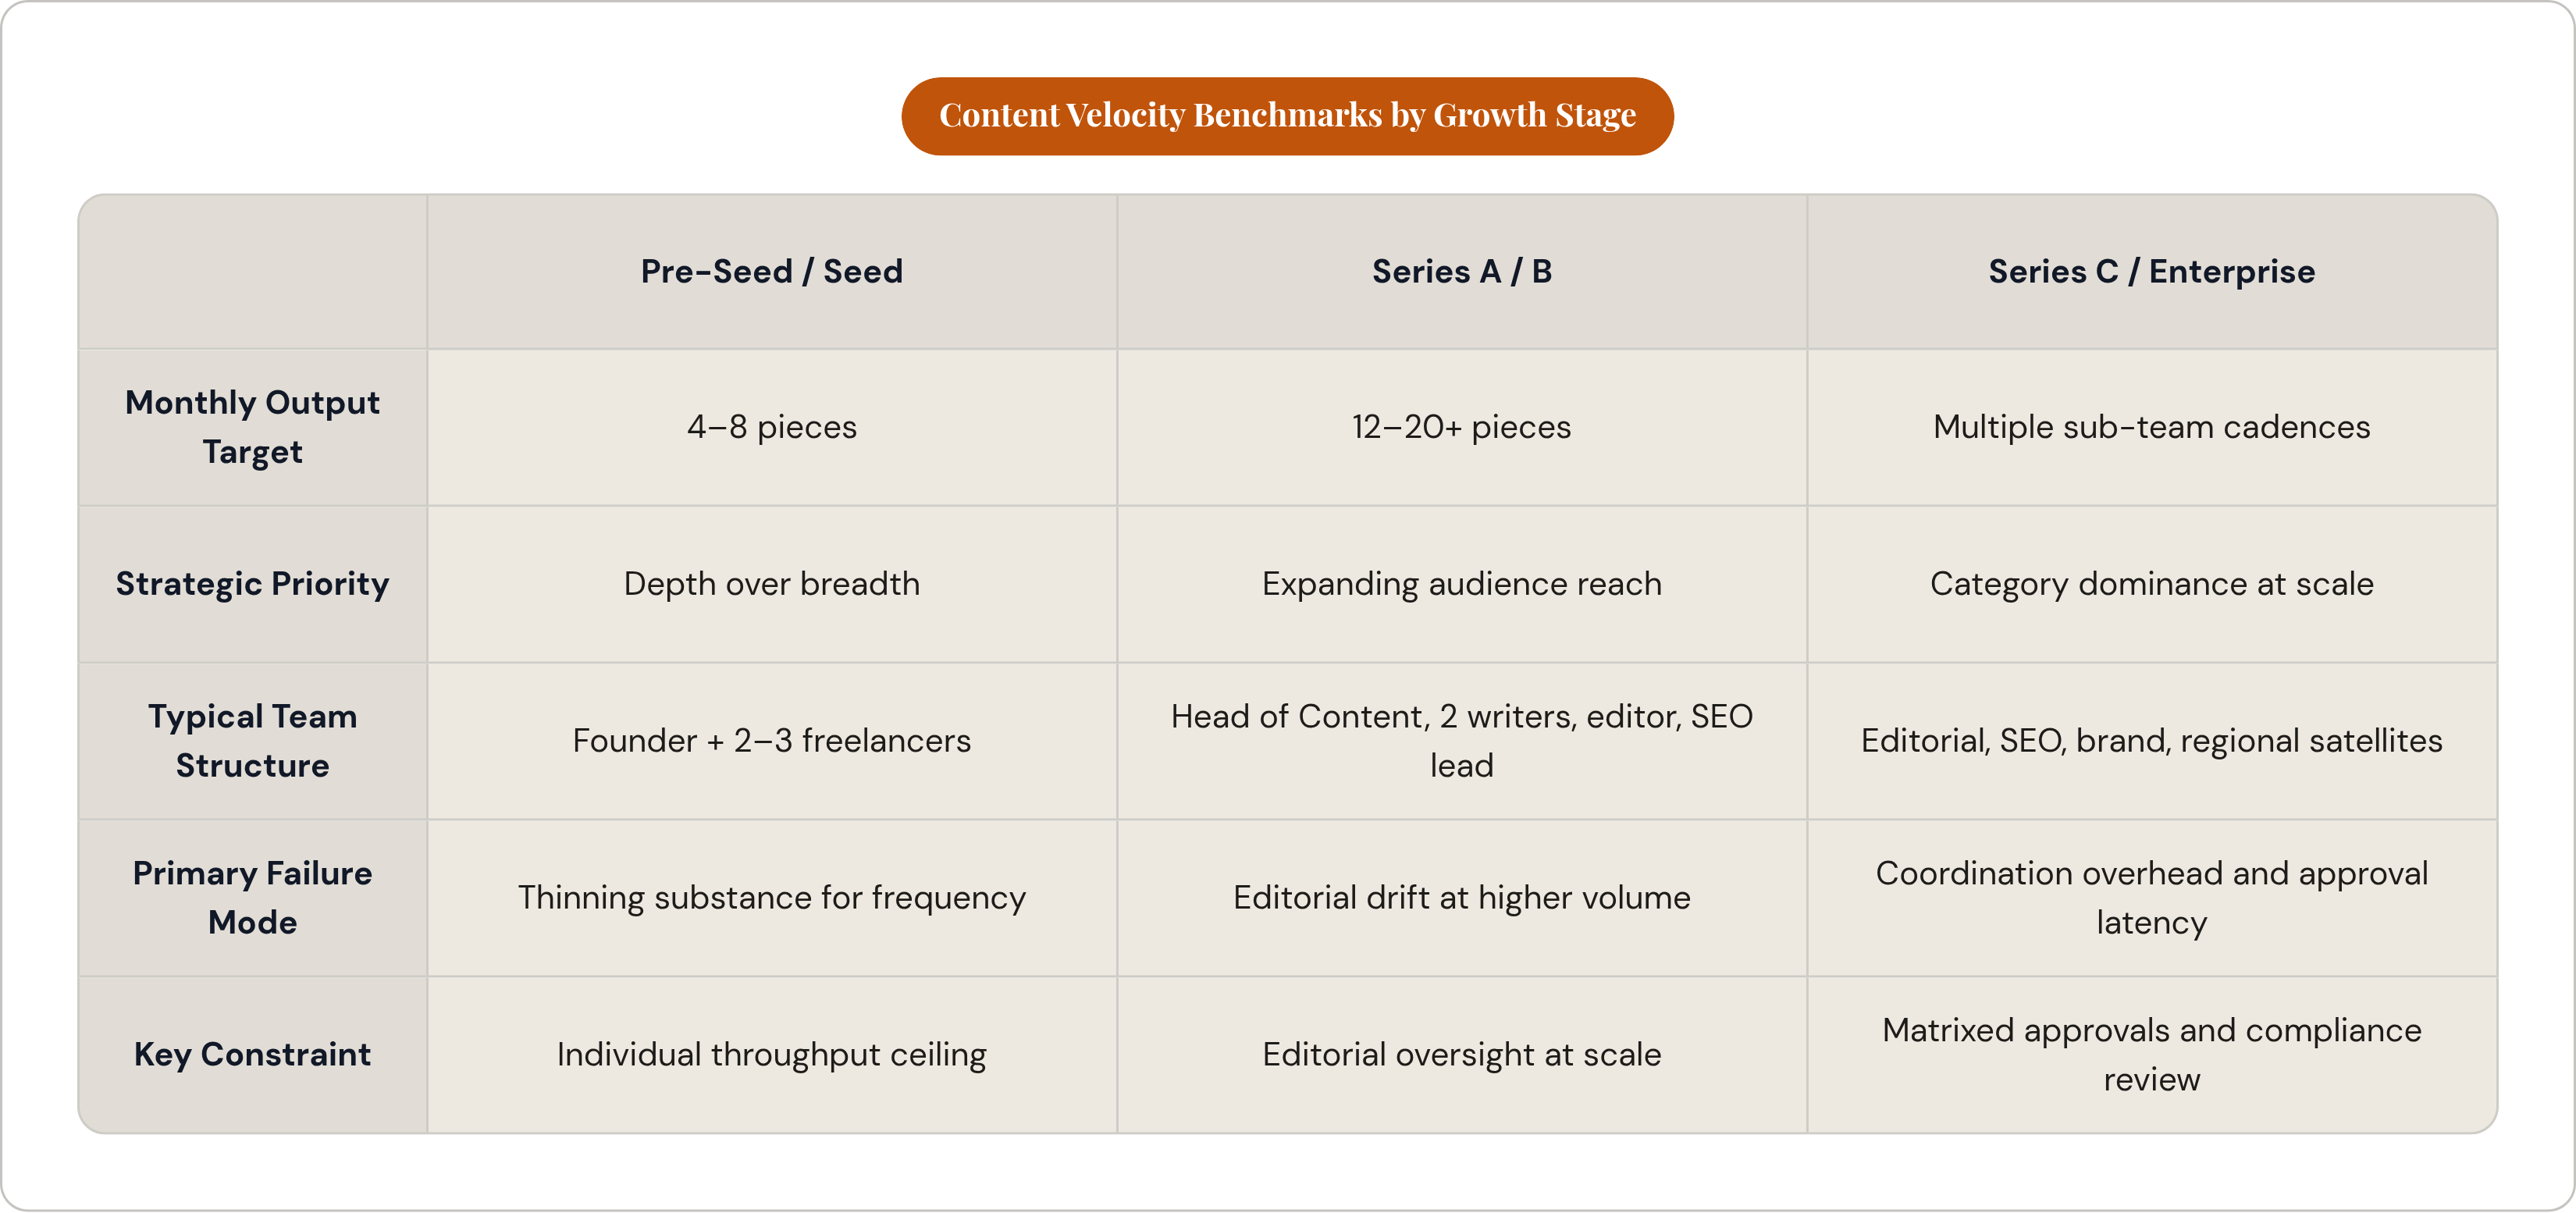
At pre-seed and seed, the benchmark is four to eight high-quality pieces per month, and "quality" is doing the real work in that sentence. The strategic logic here is depth over breadth. You are not trying to cover an entire topic universe. You are identifying the handful of subjects that matter most to your ideal customer and owning them so completely that when that person finds your content, they trust you before they have spoken to anyone on your team.
The typical team structure at this stage is a founder or a single content marketer carrying most of the load, with two or three freelancers in support. That configuration has a real throughput ceiling, and pushing past it without expanding the team almost always degrades quality. The constraint is individual capacity, not organizational design. There is no ARR-to-headcount ratio to optimize yet because there isn't enough of either.
What this team can sustain is longer-form content that is genuinely useful, with limited revision cycles, because each piece needs to be directionally right before it enters the production queue at all. The trap at this stage is publishing more frequently to look active while quietly thinning out the substance. One authoritative, well-researched post that earns bookmarks and backlinks and becomes the reference on its topic will outperform three thin pieces every single time. The four-to-eight range is not a floor to race past. For most seed-stage teams, it is the target, full stop.
Series A and B: Scaling to Twelve to Twenty or More Pieces Per Month While Holding Editorial Standards
By Series A and B, the strategic picture has changed enough to justify meaningfully higher velocity. The core content approach has been validated. The team knows, through accumulated data, what resonates with which audience segments. Adjacent topics, comparison pages, and educational content in new verticals now make strategic sense because wider audience capture has become a legitimate growth lever rather than a distraction.
The benchmark range here is twelve to twenty or more pieces per month. The team structure to support it typically includes a Head of Content, two writers, an editor, and a fractional SEO lead. There is a pattern that emerges through a certain ARR threshold of roughly one dedicated content-operations FTE per several million in ARR, with median dedicated headcount growing materially through the mid-ARR stages. Those numbers reflect the actual capacity load required to sustain both the output volume and the editorial oversight that keeps quality intact. [Source needed for ARR-to-FTE ratios.]
The failure mode at this stage is editorial drift, and it is insidious because it does not announce itself. Velocity increases, brand voice loosens, argument quality weakens, and pieces start reading as interchangeable. That erosion is not always visible in traffic numbers immediately, but it compounds against you over time because readers stop treating your content as authoritative. They do not even know why. The practical choice facing every Series A and B content leader is effectively binary: grow the content team in step with velocity targets, or adopt tooling that preserves quality standards under higher throughput. Simply writing and publishing faster, without structural support, will not keep the quality floor intact.
Series C and Enterprise: What Output Looks Like When Teams Split by Function, Region, and Product Line
At Series C and beyond, the architecture of a content program changes entirely. Velocity is no longer set by a single integrated team but by multiple sub-teams running in parallel: editorial, SEO, brand, social, lifecycle, and often regional satellites covering international markets. Each sub-team has its own manager and its own output cadence. Aggregate monthly output becomes an organizational coordination problem as much as a creative one, and the content leader's job shifts accordingly.
Headcount through this range tends to trace a recognizable trajectory: roughly 12.6 FTE at $100 million ARR, 18.7 FTE at $250 million, 27.4 FTE at $500 million, and 41.2 FTE at $1 billion and above. [Source needed for these headcount figures.] The curve flattens above $250 million ARR, and for a reason worth understanding. Large enterprises extract more leverage from process optimization and tooling than from adding central headcount. Coverage expansion gets absorbed by regional satellites rather than by growing the core team, which changes what headcount numbers actually mean as a proxy for output capacity.
The performance spread at the $50 million ARR mark illustrates something important. Median long-form output at that stage is around 14 pieces per month, while the top decile at the same headcount and ARR level ships 38 to 45 pieces per month. [Source needed for these output figures.] Same team size, same revenue stage, more than a twofold output difference. That gap is not explained by budget or FTE count. It is explained almost entirely by workflow design, which is a more tractable problem than most leaders initially assume.
Enterprise-specific constraints impose real ceilings regardless of team size. Global teams operating across time zones carry coordination overhead that simply doesn't exist at seed. Compliance and legal review requirements add mandatory latency to anything touching regulated topics or customer claims. Matrixed approval structures with multiple stakeholder gates mean a piece of content can sit in review longer than it took to write.
What Publishing Frequency Data Says About the Traffic Payoff, and Where the Curve Flattens
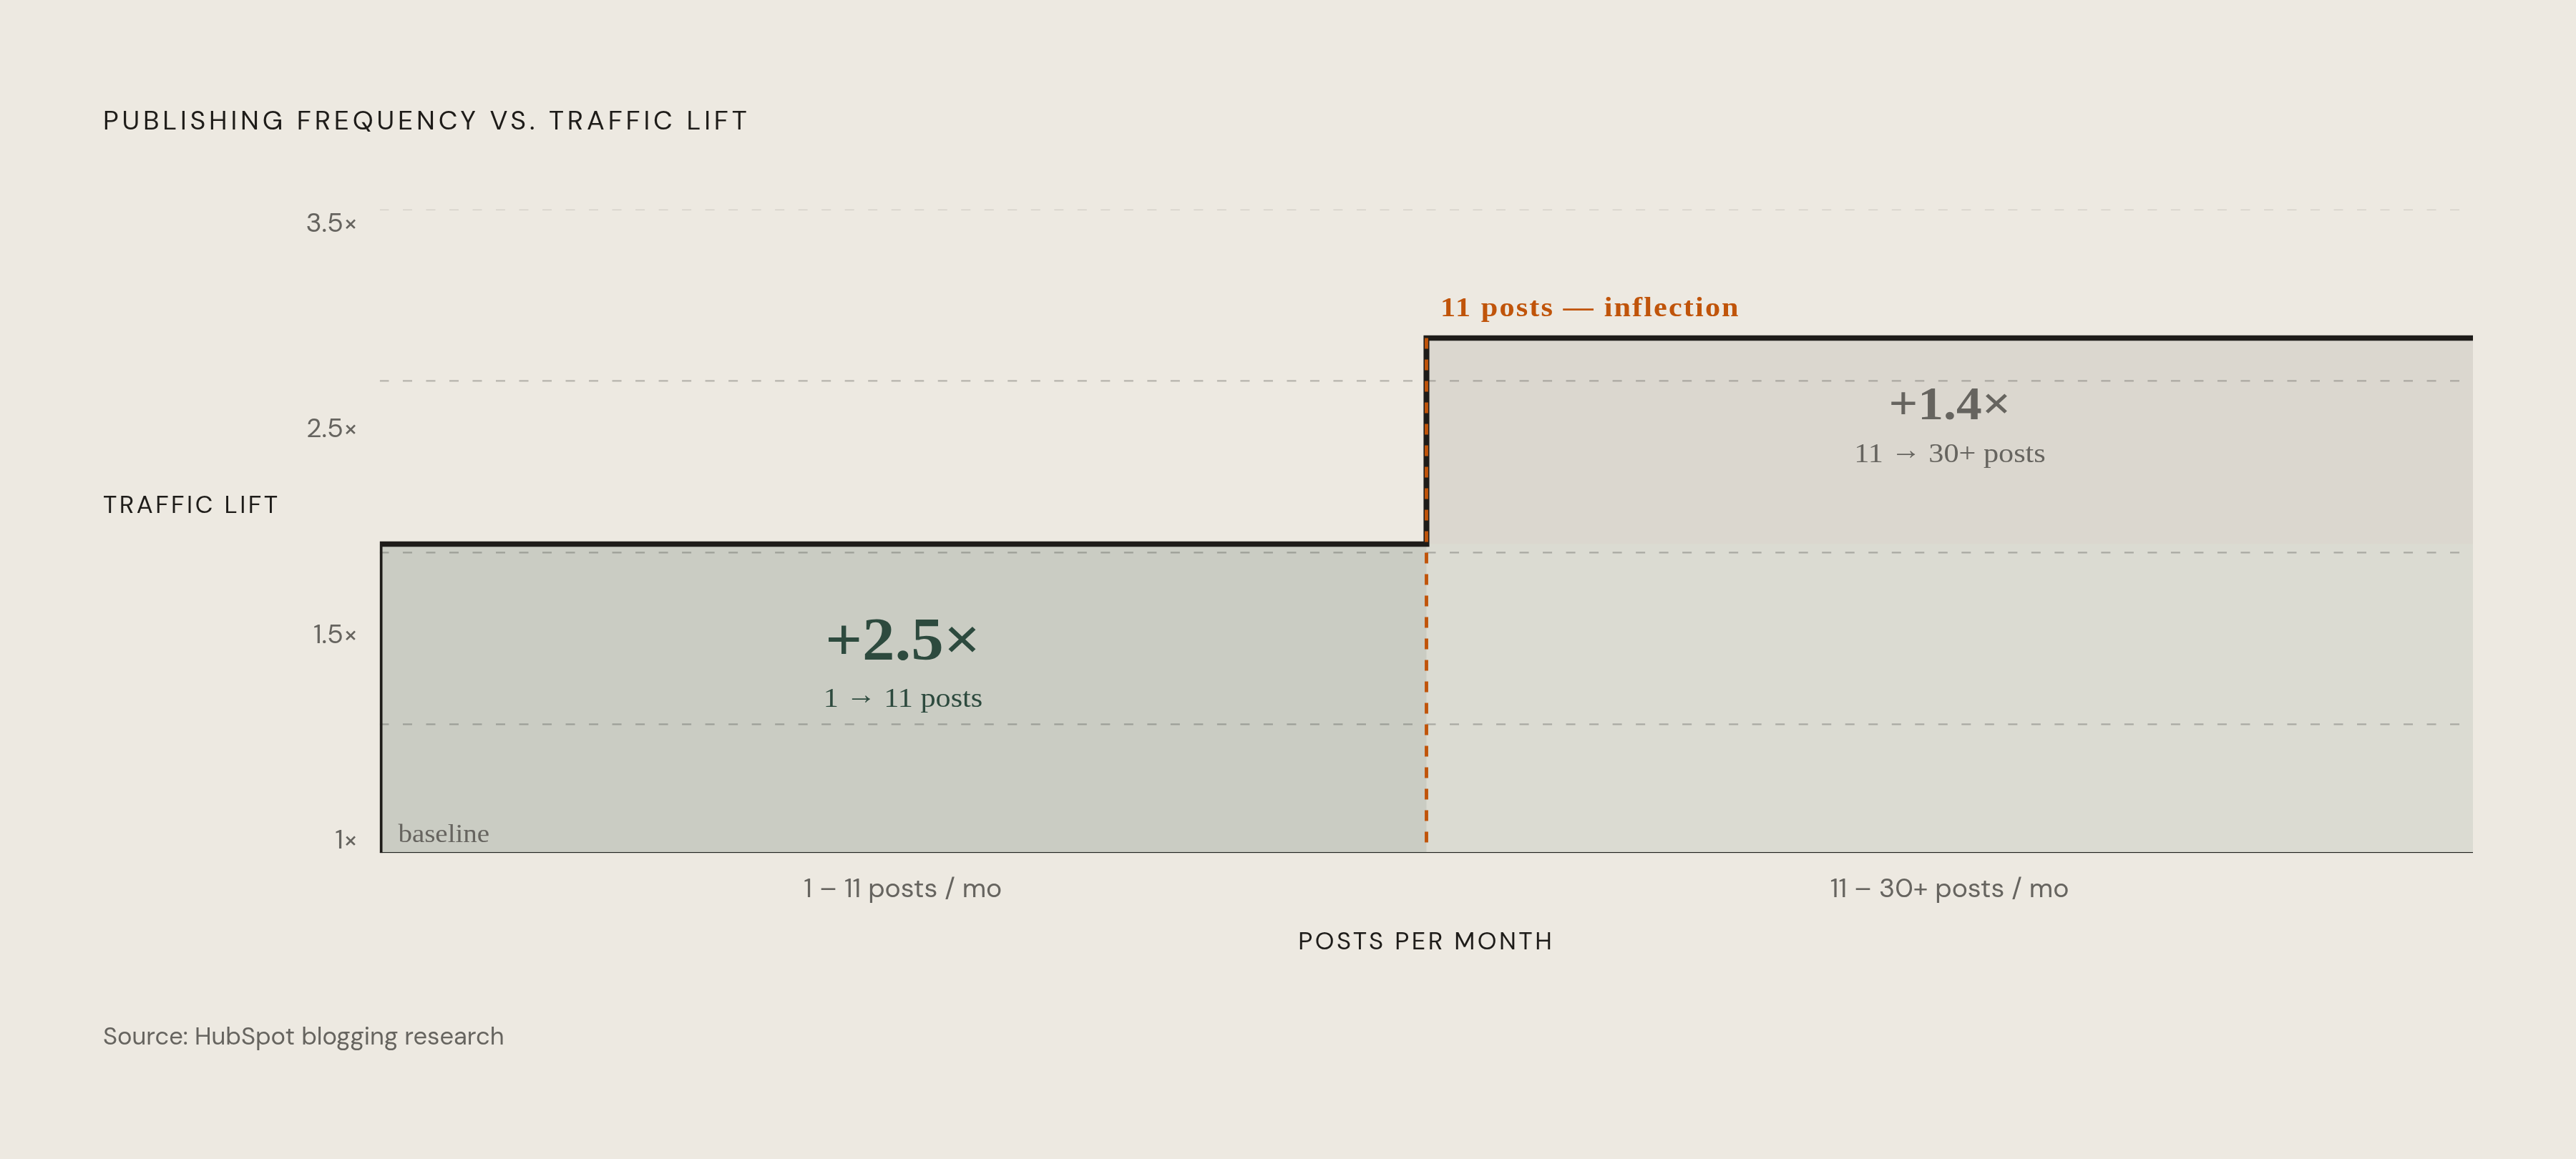
A widely cited analysis of many thousands of companies maps publishing frequency to traffic outcomes, and its findings break down by company size in ways that map directly onto the stage benchmarks described above. [Readers should consult the original published report to verify current figures, as the dataset and its presentation may have been updated.]
For small companies with ten or fewer employees, publishing more than eleven blog posts per month drove roughly three times the traffic compared to publishing only one per month, and about twice as much as publishing two to five. For mid-size companies in the 26 to 200 employee range, more than eleven per month produced roughly twice the traffic versus publishing only one. For larger companies with 200 or more employees, six or more posts per month captured 1.75 times more leads than counterparts publishing five or fewer, because at that stage the content ecosystem is already deep enough that marginal new posts compound on a larger existing base.
The diminishing-returns curve is the most actionable finding. Moving from zero to eleven posts per month yields a roughly 2.5 times traffic lift. Moving from eleven to thirty or more yields only an additional 1.4 times lift. The marginal value per post drops sharply after eleven. For most teams at most stages, the frequency benchmark worth pursuing is eleven or more per month, not uncapped volume. Beyond that threshold, investment in quality, strategic refreshes of existing assets, and distribution typically returns more than producing another net-new post.
A relevant data point comes from a high-volume publisher's recent experience. One major content-driven site saw organic traffic fall from approximately 13.5 million to 8.6 million monthly visits between November and December 2024, following Google's December 2024 core update, a loss of nearly 5 million visits in a single month. By early 2025, estimates placed their monthly organic visits in the six to seven million range. [These figures are drawn from third-party traffic estimates; readers should verify against primary disclosures where available.] What this illustrates is not a failure of frequency but a failure to pair frequency with topical discipline. High-velocity publishing that prioritizes volume over strategic coherence is a liability at scale, not merely an inefficiency. Frequency benchmarks must be coupled with genuine content strategy; treated as a standalone lever, they carry meaningful risk.
How Approval Cycles Eat Velocity Before a Single Word Is Written Faster
The average content approval process takes eight days to complete, according to workflow research cited in content operations literature. [A specific source for this figure should be identified and cited.] For anything tied to a news cycle, a product launch, or a time-sensitive campaign, eight days is the difference between relevant and invisible.
Roughly half of companies regularly miss content deadlines because of approval delays, making it the single most reported bottleneck in content production, ahead of both writing capacity and strategic clarity. [Source needed.] The problem is not that people are writing slowly. Content sits in queues, waiting for review, revision requests, stakeholder sign-off, and legal clearance, almost always in sequential chains designed for a publishing cadence that no longer exists.
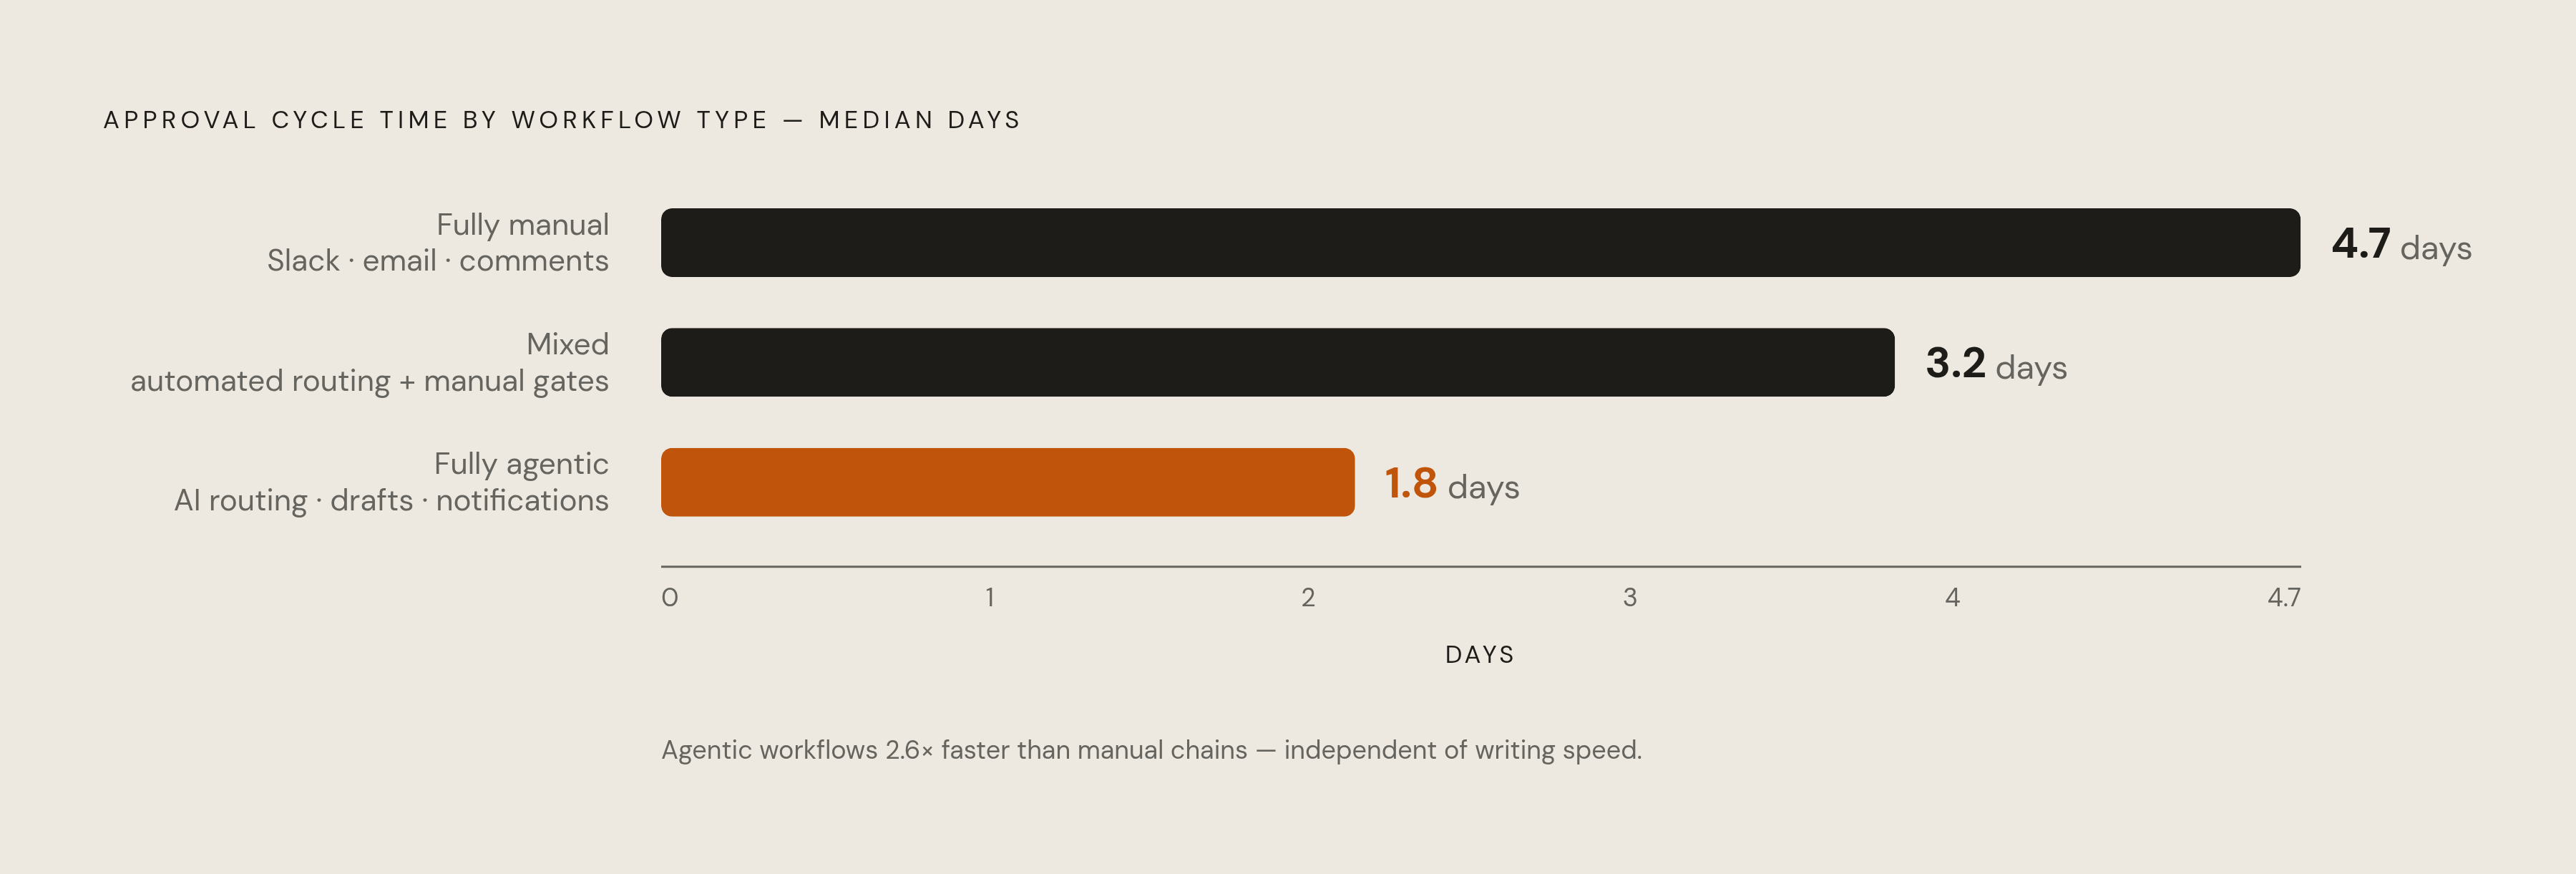
Teams operating different workflow architectures produce materially different results. Fully agentic workflows, where AI handles routing, draft assembly, change detection, and stakeholder notifications, produce a median approval cycle around 1.8 days. Mixed workflows combining automated routing with manual approval gates land around 3.2 days. Fully manual chains running through Slack, email, and document comments average 4.7 days. [Source needed for these workflow timing figures.] The gap between the first and last of those is not marginal. It is the difference between a content program that feels alive and one that chronically misses its own windows.
One pattern that surfaces repeatedly: companies running 30 posts per month spend the majority of their calendar time inside approval loops and a small fraction on actual content creation. High apparent velocity, poor actual throughput. Sequential review adds substantially longer cycle times for low-risk content that could move in parallel without any meaningful quality trade-off. [Source needed.] The output gap between top-decile and median teams at the same headcount and ARR stage traces not to AI tool adoption but to approval-workflow design. Tighter routing, fewer review loops, and AI involvement at the brief and outline stages rather than only at the draft stage are what separate high-throughput programs from moderate ones. The structural fix is routing design. For most marketing leaders, the highest-leverage intervention available for velocity improvement is the approval model, not the writing tool.
What AI Actually Changes in a Content Team's Capacity and Role Structure
AI-assisted drafting has become a common practice in B2B content production. The majority of long-form first drafts in B2B marketing involve a generative AI tool at some point in production, a share that has grown since 2023. [Source needed for this adoption figure.]
The output multiplier is real. B2B marketing teams using AI-augmented workflows have produced substantially more published assets per writer per quarter compared to pre-AI baselines, with cost-per-asset compressing significantly on AI-assisted teams. [Source needed.] But the savings redistribute rather than disappear. Writer hours per asset fall; editor hours and content strategist hours rise. Total spend holds roughly constant, and its allocation shifts toward the higher-judgment functions. This is not what most leaders expect when they make the initial case for AI tooling internally.
That reallocation shows up clearly in how role structures have evolved on AI-mature teams. The strategist-to-editor-to-writer ratio, which used to favor writers heavily, has shifted toward editorial and strategic capacity. AI front-loads volume into the review queue, which means editorial infrastructure must grow to match it or the quality floor drops regardless of how sophisticated the drafting tool is. Teams that scale AI-assisted drafting without scaling editorial capacity will see output numbers rise and quality erode simultaneously. That is a poor outcome for a content program trying to build compounding authority, and it happens more often than most leaders expect.
The macro headcount picture reflects this efficiency shift. Marketing job postings have grown at a fraction of the rate of total marketing output over the past two years. [Source needed.] Companies are operating with meaningfully fewer marketers than historical medians while producing equivalent or greater volume. The output-per-FTE assumption embedded in benchmarks written before 2023 is no longer valid. A team of five with mature AI tooling and a tight workflow can now sustain what previously required eight to ten people, which has direct implications for how benchmarks by team size should be read and applied.
One additional pattern worth noting, because it runs counter to the instinct most teams have: top-decile content teams use fewer tools, not more. They maintain one primary AI writing tool rather than a collection of overlapping ones. Over-tooling is emerging as its own drag on velocity, distinct from under-investment, but just as real. [Source needed for tool-count findings.]
Reading the Benchmarks as a Calibration Tool, Not a Performance Ranking
The benchmarks mapped across these stages and team sizes are planning parameters, not scores to optimize against. A seed-stage team producing eight pieces per month with genuine depth and a tight editorial voice is performing well. A Series B team at the same number with twenty employees is either under-resourced or trapped by workflow friction. The number means nothing in isolation; context is the whole point.
Three questions can orient any team trying to read these benchmarks accurately. Is current output appropriate for this stage's strategic priority, whether that is depth, breadth, or scale? Is the gap between target velocity and actual velocity a headcount problem, a workflow problem, or a tooling problem? Those three have different solutions, and conflating them wastes time and budget. And is the approval cycle compressing the impact of otherwise solid production capacity, so the team is writing well but losing velocity in the handoff?
The frequency-to-traffic data sets a practical ceiling for most organizations. Reaching and sustaining eleven or more quality pieces per month captures the majority of the available traffic gain from frequency alone. Investment beyond that threshold yields diminishing returns per post and is better redirected toward quality improvement, content refreshes, and distribution.
The role-mix shift toward editorial and strategic capacity carries a direct planning implication. Teams scaling velocity without scaling review infrastructure will see quality erode even as output numbers climb. The bottleneck moves from drafting to review, and if that infrastructure hasn't grown to match, the program stalls in a different place than before, often without realizing why.
Stage-appropriate velocity, combined with workflow discipline and a team structure calibrated to the current growth stage, is what separates content programs that compound into durable assets from ones that generate volume without building anything that lasts.