Content Production Speed Benchmarks for B2B Marketing Teams
Governance and approval workflows, not AI tools, determine how fast your team produces content.

Views on AI or content rarely match B2B groups, yet the data finally gives any of them a benchmark: their own pace against an actual spread, not a guess. Governance and following a routine explain the gap between the quickest teams and the slowest, rather than what tool sits at the top. Plenty of groups get it wrong, pointing at the model itself when the real constraint sits downstream in approval steps and a missing policy on AI use. Fix the misdiagnosis first, before you change any workflow, because nothing else matters.
What the headline output numbers actually mean
The Starr Conspiracy's Q2 2024 State of B2B AI Marketing Report polled 312 B2B tech marketing organizations and found AI-augmented groups produce 4.2x as much material per author every three months as in their pre-AI 2022 baseline. For a typical 1,500-word blog post, Time-to-first-draft fell, going from median 4.6 to 1.1.
Most groups shouldn't count on reaching the 4.2x figure, treat it as an upper limit instead. CMI's 2025 survey with MarketingProfs found just 44% of B2B content marketers turn to AI for drafts. Everyone else leans on it for brainstorming or summarizing content that already exists, tasks touching the output without taking its place. If a team has AI make an outline, the work is nowhere close, not within shouting distance, to that same multiple; pretending otherwise ends with the team disappointed by a tool that could never move the number they’re chasing. Only a small share of groups got that 4.2x result by using AI throughout their drafting work. Everyone else measures something different but treats it as that benchmark.
Where production time actually goes, and why AI generation is only part of it
It's easy to measure how fast Drafting goes, and easy to make that part quicker. That part of the pipeline is the tiniest. Editing plus revision take somewhere from 60% to 70% of all production time for typical marketing groups, yet that step hardly shifts once AI is bolted in early. A quicker draft won't speed up your launch, and if you're measuring anything else, you're tracking the wrong part of the pipeline.
Even when one blog post drafts in 1.1 rather than 4.6, it still goes through the identical approval chain: matching stakeholder sign-offs and those same brand checks from before. Many marketers hit production bottlenecks while scaling, even inside organizations that already adopted AI. That jam just moved. It shifted downstream, away from whoever's measuring draft output and celebrating that number.
When you check with groups about scaling blockers, their answers have nothing to do with output pace. Insufficient repurposing of content, since a single asset doesn't get reused in other formats, and silos between groups that aren't coordinating despite needing to, both rank among the most top-cited blockers, and each is a workflow failure. A quicker model won't solve either problem.
BCG's October 2024 report, Build for the Future, found AI cuts average marketing operations time per asset by about 30%. This blended number spans the whole pipeline yet hides how lopsided the distribution is: most of the saving lands during the draft stage, while teams who never restructured review may see less impact. Time-to-publish means the whole time from request to live asset, the honest number. Time-to-draft makes for a nice chart, yet it says little about how fast content reaches people.
The cost side of the speed equation
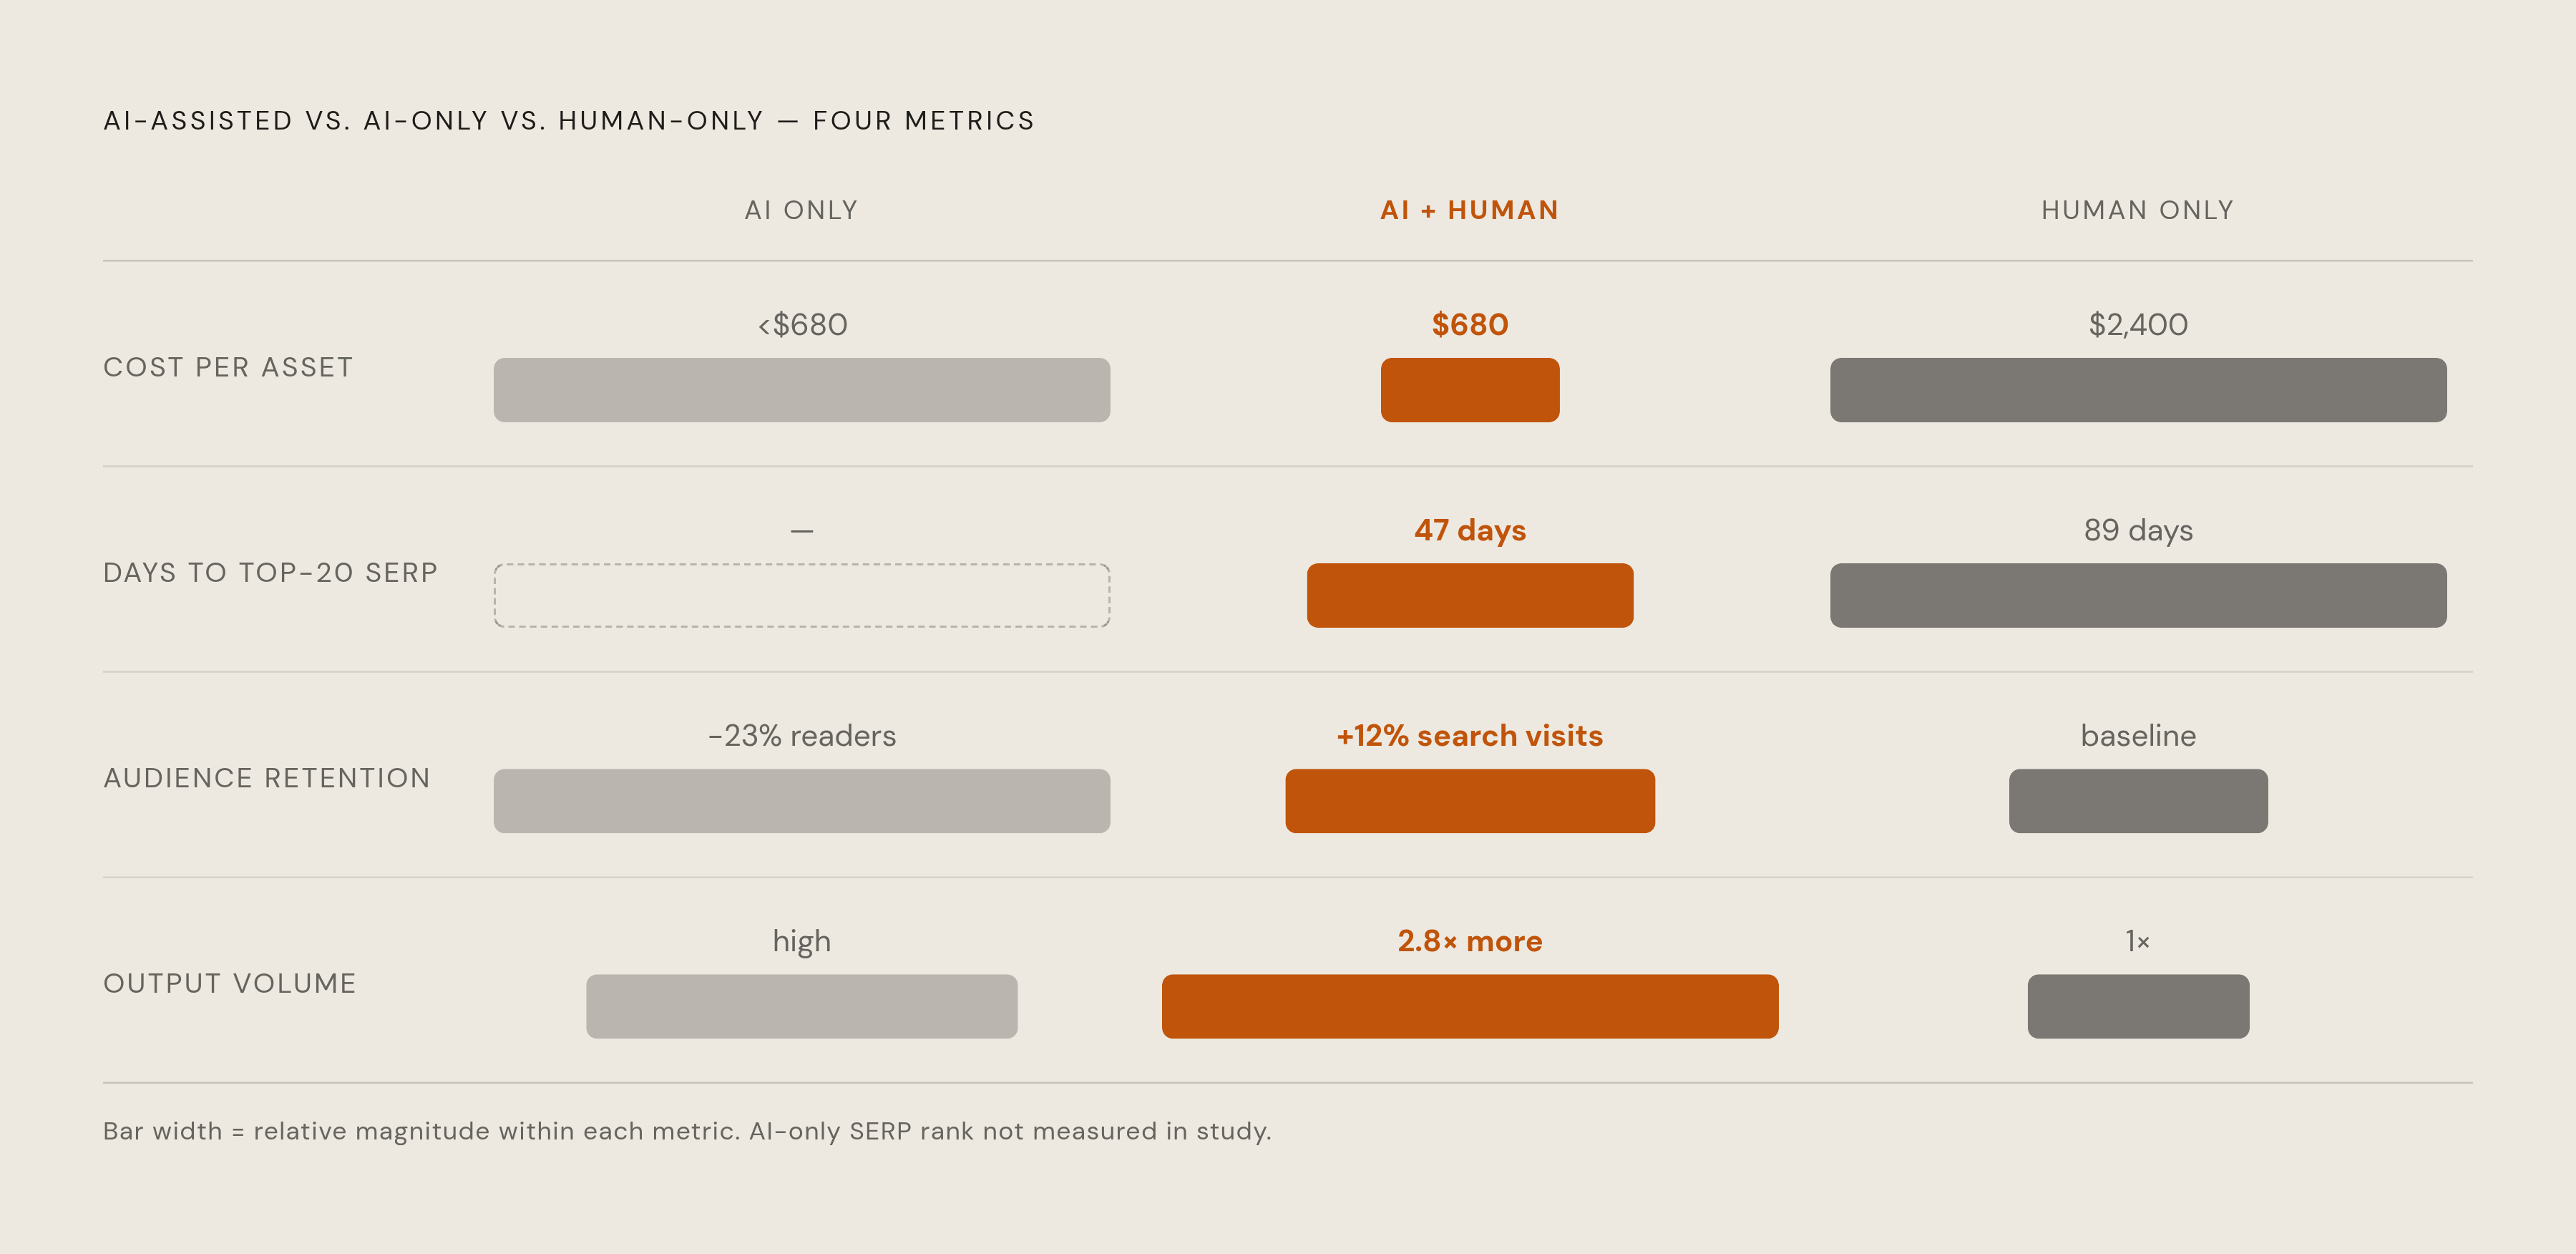
Search Engine Land's production-cost benchmarks place the median fully loaded expense of a B2B AI-assisted long-form piece, with human editing plus fact-checking and SEO, at $680. One fully human-produced piece with similar reach costs $2,400 today.
That $680 figure assumes someone human still takes a pass. Leave it out and you end up with something fundamentally changed, not merely less expensive. You get a bad asset with actual problems, and treating it as the same is wrong. Ahrefs' aggregated data shows AI-only content loses 23% more readers right away, whereas AI-assisted pieces given a human edit pass draw 12% more search visits than work people did themselves. That edit pass isn't optional overhead just tacked on, but a key part of how AI workflows run. That workflow step is what makes all the other steps matter.
The data backs no extreme: AI-only output drops audience, while all-human work takes more money and time. The hybrid model pairing an AI draft with a human edit is where the forces converge. Semrush's AI Content Impact Study (Q1 2025) found AI-assisted content reaches top-20 SERP spots with a median of 47 versus 89 for similar human-only work, and that AI-assisted cohort put out 2.8x more content during the study period. Faster rankings, more posts, cheaper per article. Those gains stack, so groups reaching the $680 plus 47-day level aren't merely effective alone. They create scale that moves every result ahead.
The governance gap that explains why 70% of AI pilots don't scale
Many firms still lack tangible returns from AI spending. Most pilots for content stall before becoming normal work, and weak output is usually not why.
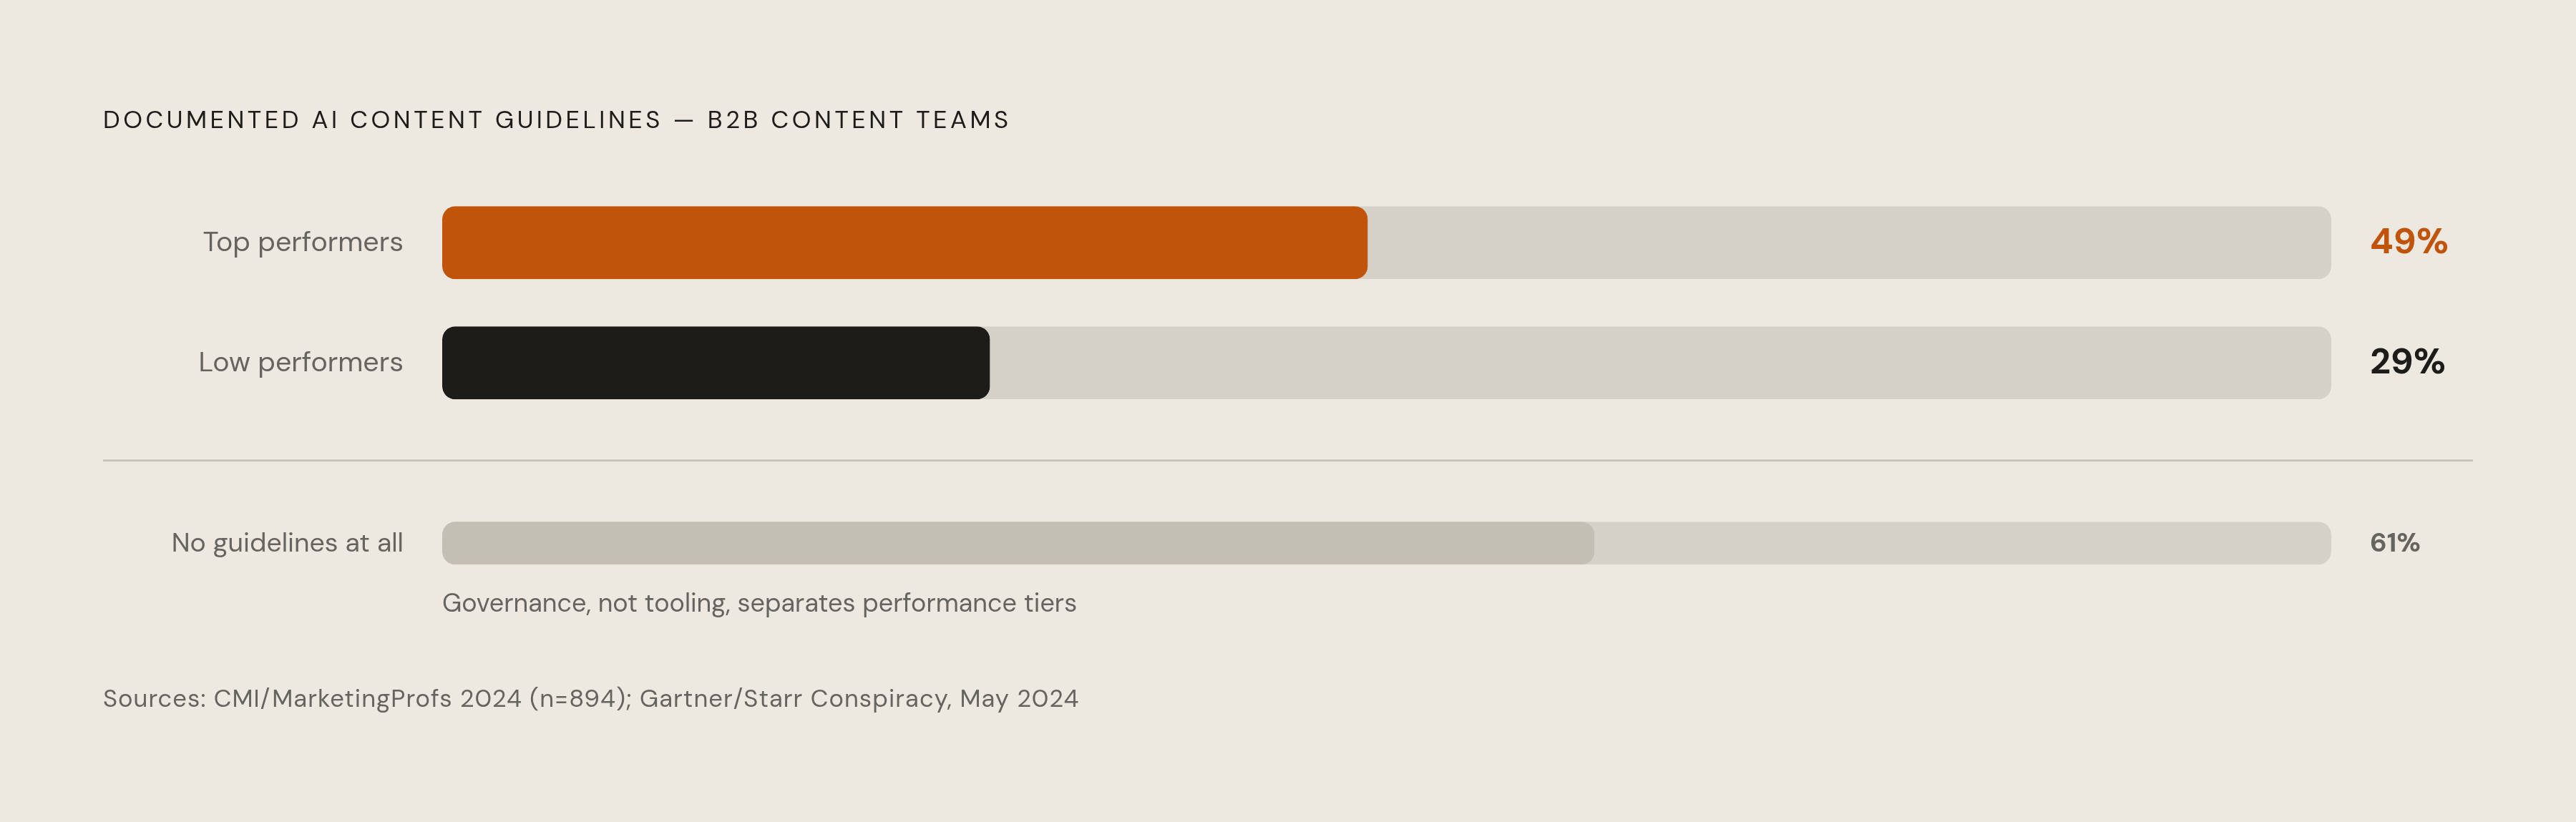
The problem is governance, or more precisely, that nobody has it. In May 2024, Gartner's CMO Spend & Strategy Survey, which The Starr Conspiracy aggregated, found just 28% of B2B organizations had an AI governance policy documented. CMI and MarketingProfs' 2024 survey (894 B2B respondents, fielded in July 2023) found 61% of B2B organizations have no guidelines at all for how AI gets used in content. That gap hasn't really moved much, which is why pilots die on the vine instead of becoming process.
Here, the gap between everyone else and top performers is clear. The 2025 CMI and MarketingProfs data shows documented generative guidelines at 49% of top B2B content groups, compared to 29% among the worst performers. Without guidelines, brand voice quickly drifts: Q2 2024 data from The Starr Conspiracy's found about one in every 4 or 5 lines from first-generation AI drafts is flagged for off-voice issues among surveyed B2B groups. Rushing past governance means paying for cleanup no one budgeted.
McKinsey's March 2024 aggregated numbers indicate content that is AI-generated still demands a 31%–47% human edit rate based on total word count before becoming publishable. That figure is nothing to feel embarrassment about. It is a fixed workflow input, just another line item; teams failing to plan for it will find the gap in a different place on the ledger, often as a late delivery without a clear cause.
How team structure shapes where a B2B team sits in the benchmark range
How this plays out largely gets locked in before automation shows up. For bigger B2B firms with 100 or more staff, CMI and MarketingProfs data from 2024 shows 50% send content needs to a single centralized group, 23% have every unit create its own, and 21% divide tasks among units and labels.
Centralization works best here because the setup is simple: one team can enforce policy governance, protect voice for the brand, and measure the velocity alike for each asset. Many B2B organizations running no defined content production process often face challenges in split ownership setups. Roughly a third of B2B marketers report having a scalable content model in place (CMI 2025), while many skew to fragmented, multi-owner setups.: when control stays fragmented, you can't enforce one policy without a central spot to do it.
Agencies with multi-brand portfolios inherit it multiplied across each client. Every client runs as its own governance area, with a separate brand voice, an approval chain apart, and its own risk handling. Measuring results for every client without one workspace requires rebuilding identical reports for each one, every time. Tools designed for exactly this hand agencies a single workspace for the whole client roster, keeping per-brand rules distinct while cumulative analytics pull results together. What was a hands-on chore for portfolio-wide governance becomes a quick dashboard glance.
Where AI-generated content now lands, and what that changes about the speed-quality tradeoff
Google's AI Overviews reached 48% of queries as of April 2026, up from earlier in 2025, touching roughly 2 billion monthly users. It sits ahead of any standard blue-link result in the path most searches take.
Everything shifted on 27 January 2026, the day Google put AI Overviews on Gemini 3. Many of the domains getting picked up before were replaced. The overlap tying any page's top-10 ranking to getting named in an Overview, previously higher, collapsed to a lower range, based on the dataset you use (numbers from Ahrefs). Ranking highly as before buys citation far less often now, and groups still optimizing just for spots 1 through 10 keep chasing a measure that matters far less than it once did.
This change counts because people shopping are already in those AI answers. Many B2B decision-makers now turn to generative AI while looking at their options. Content earning no citation in those answers stays hidden from almost the whole purchase group before any salesperson gets a meeting booked.
Research found that putting numbers into content lifts visibility in AI, while data-backed writing outperforms pieces lacking it in every AI tool. Most of the links AI gives point to organic coverage instead of purchased spots, so strong production and a heavy load of honest, checkable details count for more than any ad spend could.
Shallow content once meant fewer visitors for a group. Today it hits two ways: first in classic ranking, then within AI layers ahead of it. The bar for what's acceptable rose rather than fell, and benchmarks made for quick, thin output keep chasing something that exists nowhere anymore.
Using these benchmarks to locate your team on the performance curve
That data offers crews something real to use when they measure themselves. Output velocity: live pieces per person every three months, putting 4.2x higher than the pre-AI baseline for the top proven workflows. Time-to-first-draft: 1.1 hours using AI on a 1,500-word post, versus 4.6 hours by hand. Time-to-top-20 SERP tracks the median benchmark for AI-assisted content at 47 days. Cost-per-asset, fully loaded, with editing plus QA: $680 under an AI-assisted hybrid model versus $2,400 with human-only. Governance: how much production falls under a documented policy plus brand voice rules, with top performers at 49% while everyone else sits far lower.
Most groups fall into one of a few camps, and being honest means figuring which applies without flattering anyone. Without any structured workflow, 31% lack a benchmark target, because no baseline exists until you build one. Some teams go to AI purely for brainstorming plus outlines; velocity rises only slightly, the spend barely drops, and 4.2x never comes close, however a tool is marketed internally. Fewer teams use AI to write complete drafts, adding editing by humans and governance that's layered on the top, yet only they hit the stated benchmarks covering velocity, expense, plus SERP speed together. That third group is the only one actually competing on the numbers this piece opened with. Those remaining teams are chasing something else while treating it like the same contest.
The upside of hitting that best-in-class group goes beyond operations. Starr Conspiracy's Q2 2024 data found an 18% median increase across marketing-sourced pipeline after operationalizing content with AI, meaning those time savings ultimately surface in attribution rather than only on the production dashboard.
With agencies, benchmarking must be done across all accounts, not individual-client by individual-client, or the picture remains incomplete. Cumulative analytics for each client, segmented to keep every account's data apart, form the baseline for seeing which clients show lagging results and where the workflow breaks down. Per-client data drops and reports each week do that job, surfacing gaps in velocity and governance for every client so nobody is manually stitching spreadsheets on Monday.
The organisations leading these benchmarks didn't reach that point by purchasing more tools. They reached it by setting up governance, clear roles, and tracking habits that make their tool repeatable. These benchmarks reveal the ceiling. That maturity keeps it going.