Reporting Content Performance to the C-Suite and Board
Marketing teams must translate vanity metrics into revenue impact to influence board decisions.

Marketing teams have vast data, but boards use little of it for any decision. Ad loads, clicks, and visits stack up in terabytes, yet hardly any fit how a CFO or director sees things. It's a translation problem, not a data problem, and marketers who fix it use board meetings to drive the company's direction instead of justifying their budget.
Most marketing leaders don’t want to admit how deep the illusion really goes. According to WordPress VIP's 2024 study, 87% of C-level executives claim they clearly or somewhat clearly grasp content performance. Fine, so far. Just 30% say their strategy is data-driven, yet 49% admit it isn't. The gap between those two numbers is more than minor. Executives think they get performance simply because they see a dashboard, not because the dashboard helps with any decision they need to make.
Marketers show up to board meetings armed with impressions and click-through rates. The CFO is focused on the balance sheet. Two different rooms wearing the same badge, and the mismatch just got more expensive: The Gartner CMO Spend Survey shows marketing budgets at 7.7% of company revenue, down from 9.1% the prior year. Smaller budgets make accurate reporting essential, not optional. When content's link to revenue isn't clear, marketing looks like an optional cost, and those get cut first in a downturn.
Why attribution is so hard to get right, and why that's not an excuse
Only 21% of marketers can accurately measure content ROI. Content quality isn't the issue, as blog posts aren't worse now than five years ago. It's an attribution infrastructure problem, and CMI's 2025 B2B research shows many content professionals struggle to attribute ROI to content.
Blame the buyer's path, not the tracking software. A buyer reads an article, closes it, returns after three weeks, shares a case study, joins a demo, goes silent for a month, and finally converts, if that’s even the right term for such a tangled process. One blog post or webinar usually happens halfway through this process. It seldom closes a deal alone; its ROI usually builds up over 6 to 18 months. The conflict with quarterly board reports is no accident. The problem's built-in: boards demand updates every three months while results take as long as refinancing a home.
Content needs to be shown as influence with proof, not as a machine that instantly produces revenue. Many teams approach this the wrong way. They see the missing link in the numbers as the problem to solve, yet 44% of B2B marketers, per CMI, still can’t connect content to real results, and that mistake began long before the reports. The problem begins earlier, with the goals set before the campaign started. If nobody agreed what "success" meant at the outset, no attribution model fixes that after the fact.
Don't fall back on pageviews just because they're simple to get. Teams that build the infrastructure get paid for it, literally: those that track revenue attribution see larger budget increases.
What vanity metrics actually cost when they land in a board pack
It's an obvious, common dashboard mistake, more an unbroken habit than an actual error. Pageviews, impressions, and social shares appear front and center on the top slide, clearly, proudly, without any link to the business goals. Traffic goes up and to the right. Pipeline contribution remains unclear. Everyone applauds, yet no one knows why.
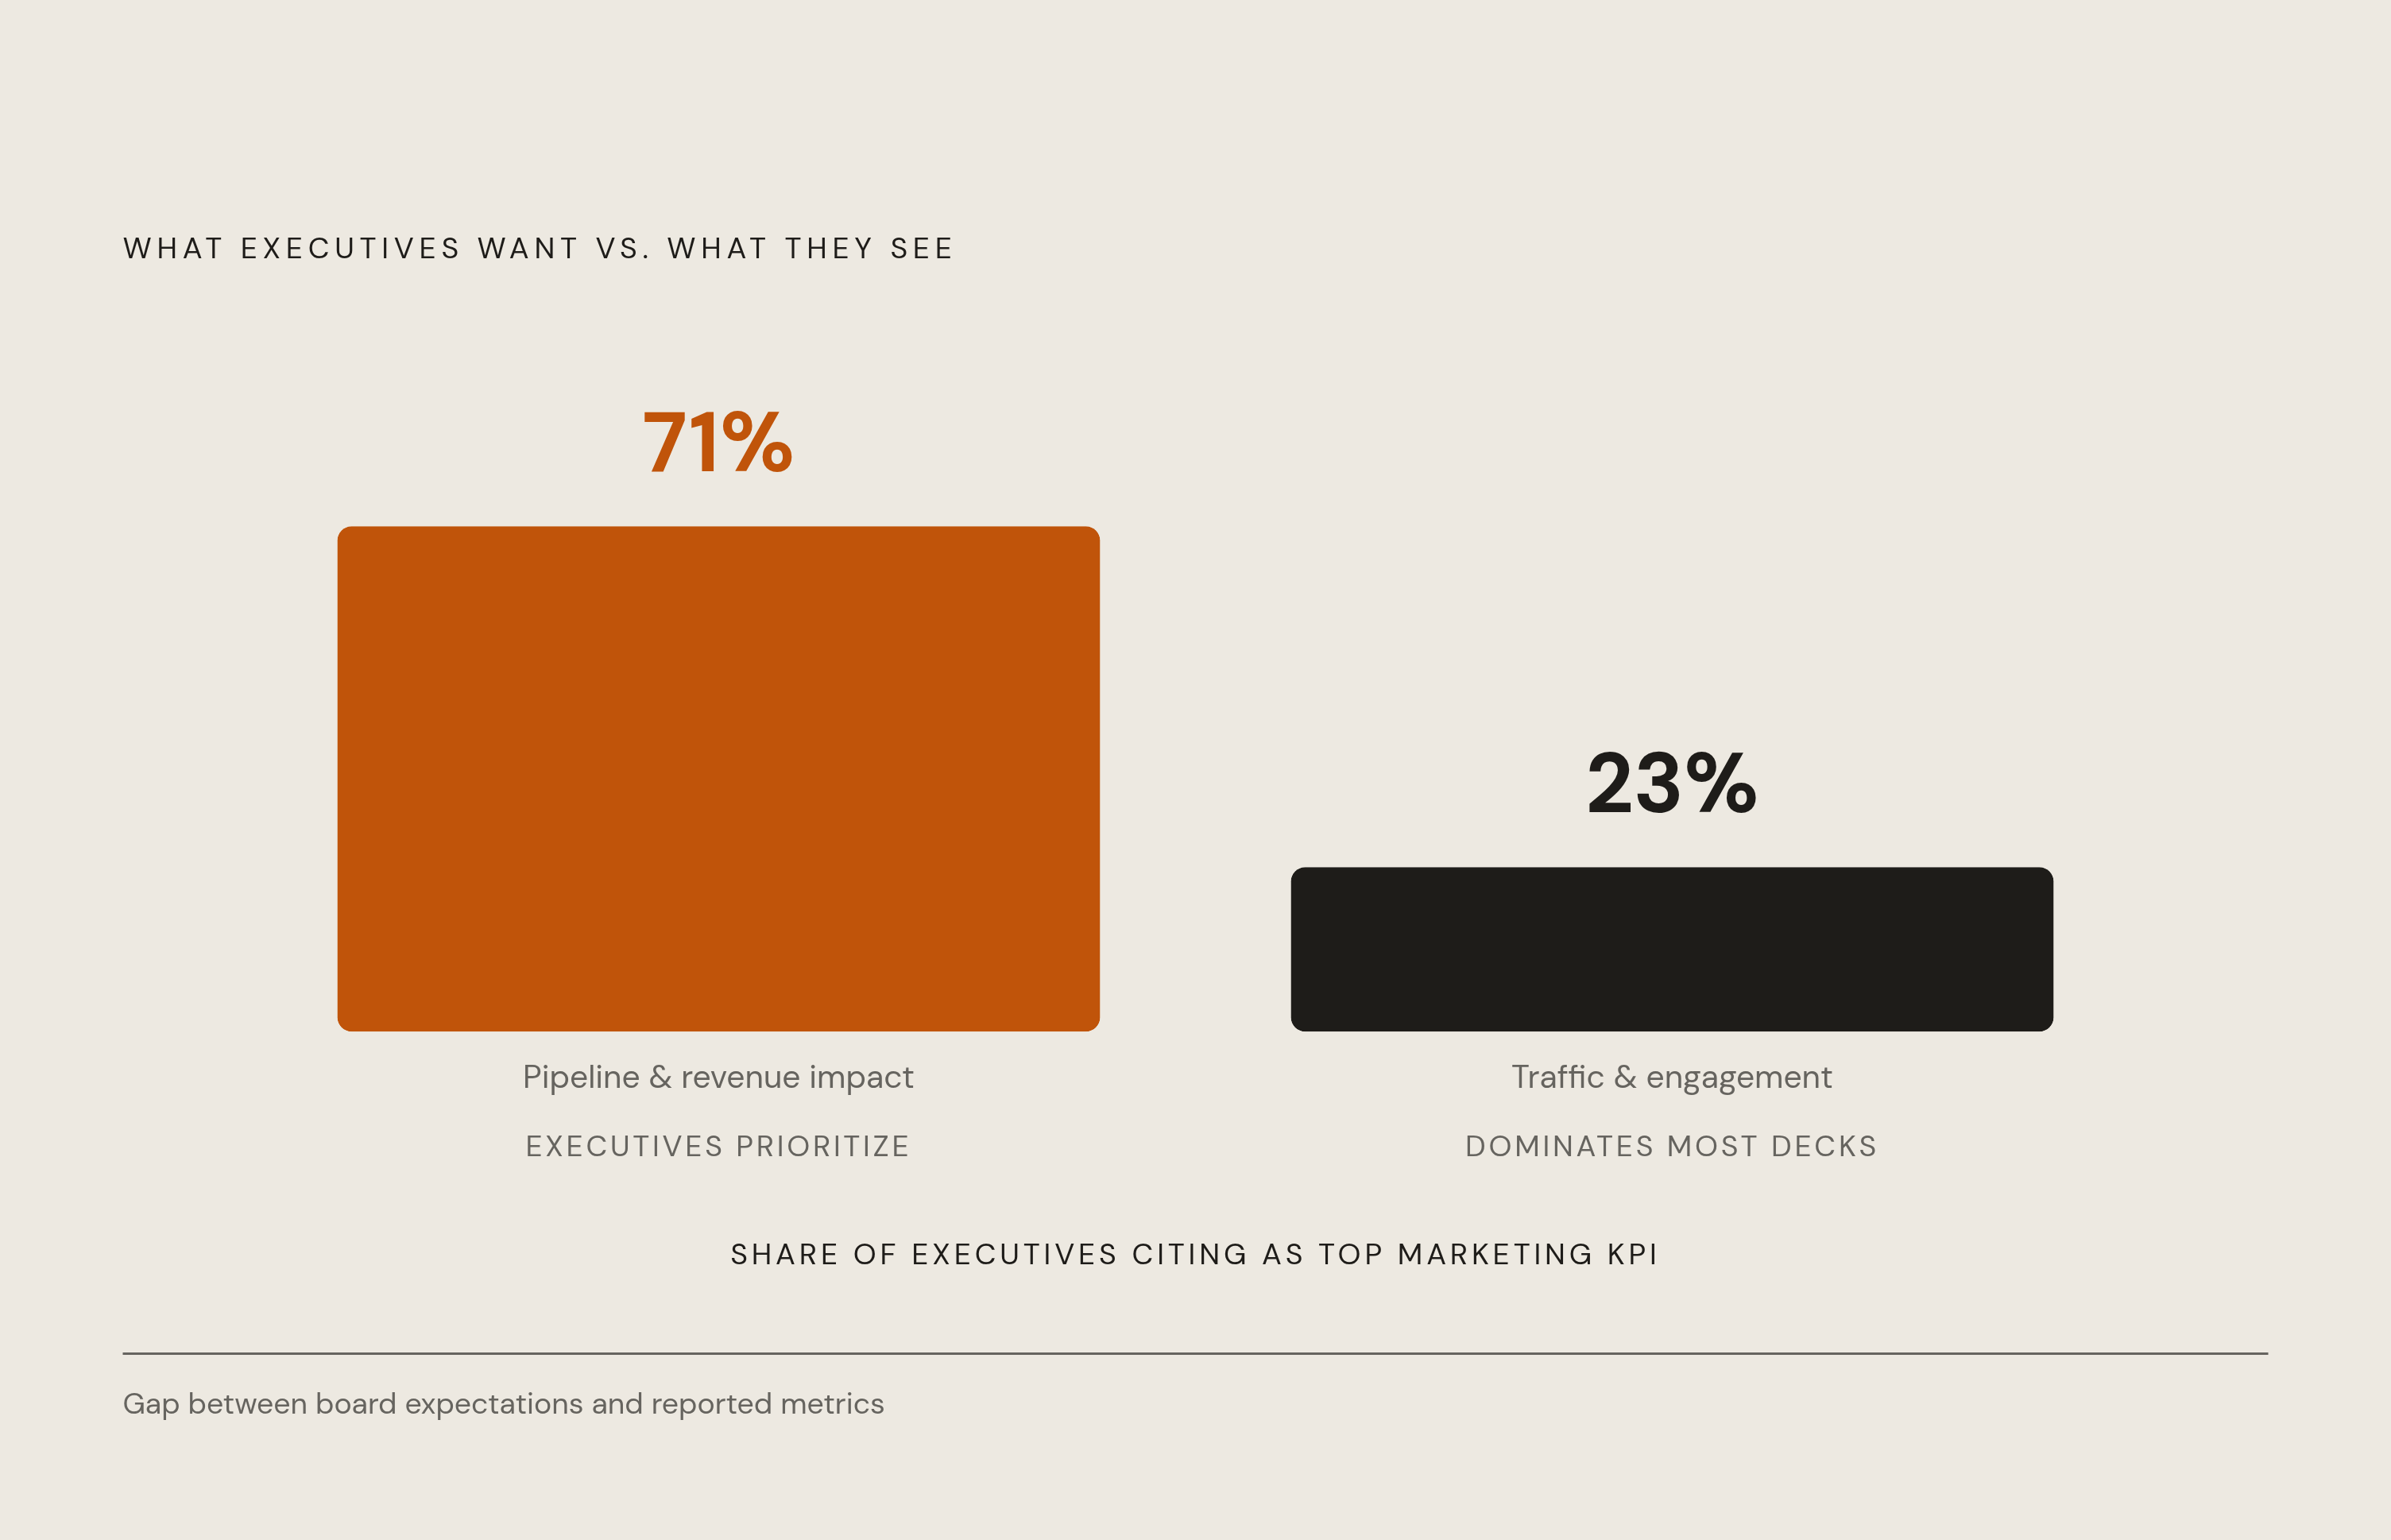
Before you present, ask one thing: does this key number clearly connect to revenue? If it can't, send it to an internal review, not the board. Research shows a clear divide: 71% of execs rank pipeline and revenue impact as top marketing KPIs, but just 23% focus on traffic or engagement. It’s a clear choice, and calling out the mistake of treating it as close is important.
Context can tweak the rule, but only slightly. A metric might be valuable for one company but useless for another. A SaaS company trying to book demos considers website traffic a vanity metric, because traffic alone books nothing. For a media company monetizing ads by page views, that traffic count matters, it’s what they sell. What matters isn't how impressive a metric sounds. The key is if it relates to the exact goal that company is pursuing.
Mention "1,200 leads generated" in a board meeting and see the reaction. It doesn't produce a decision. It produces a follow-up question: how many converted, what's a lead worth, why should anyone care. Executives tune out or demand the real number behind the number, either way, the person who made the slide takes the hit.
The metrics executives actually use to make decisions
Before a metric hits the deck, filter it: if this number changed, would the board's decisions on hiring, spending, market expansion, or sales coverage be different? If it wouldn’t change their decision, leave it off the slide and tuck it in a report only marketing reads.
Three metrics always make it to the boardroom table, and all others are trying to win a place. CAC Payback shows the time it takes for a customer's revenue to repay the cost of acquiring them. The LTV:CAC Ratio helps the board distinguish healthy growth from noisy growth by comparing lifetime value to acquisition cost, revealing true efficiency versus a temporarily successful spending spree. Pipeline Velocity shows the speed of opportunities moving through the funnel, linking content efforts to sales results without vague assumptions.
Look at two examples. "1,200 leads generated" is just an activity report. "Pipeline coverage fell from 3.4x to 2.6x in the mid-market segment, putting Q3 at risk" is a board-level statement, because it forces a decision: fix the pipeline, adjust the forecast, or reallocate sales coverage. CEOs no longer settle for just "pipeline influenced" as an answer. They want net-new revenue tied to marketing, showing growth is real, not just hopeful.
The solution mainly involves changing the terms used at the start. Swap "impressions" for cost per qualified lead. Change "sessions" to demo requests. Swap "email opens" for email-sourced pipeline. Each one swaps a vanity metric for a number that links to revenue or a deal milestone.
Boards are now looking beyond just financial data. Strategy execution scores, net promoter scores, and employee satisfaction are now included with revenue metrics to reflect long-term health, not just one quarter’s results. Build the report as a pyramid, with each level relying on the one below: awareness metrics lead to engagement, which drives conversion metrics (MQLs, SQLs, opportunities), and conversion ultimately fuels revenue from deals tied to your content. Miss a level, and the board just sees guesswork disguised as data.
How to build a reporting cadence and format that executives will actually read
The reporting schedule should fit the audience, not just follow a set timetable. Marketing leadership gets monthly conversion and pipeline velocity numbers, aligning with the team's weekly steering rhythm. The board and top execs get updates every quarter, timed to when they call the shots, not when marketing drops new posts.
Frequency is just as important as format. Executives want the result right on slide one, not hidden on slide fourteen under a bunch of impression counts. Cut the clutter and scrolling, show the key figure next to its target goal.
Check the numbers before they go to the room. MQL counts, conversion rates, and deal sizes must be consistent across the CRM, marketing's tracking, and the CEO's office's data. A single challenged figure in front of the board does more damage than a missed target ever could. A shortfall hurts the bottom line. A wrong number creates a trust problem, and trust is lost faster than it's regained.
Charts can show things that tables can’t. Visuals convey funnel trends, KPI shifts, and conversion rates more quickly and memorably than spreadsheets, which no one has time to decipher during a meeting. A useful shortcut is creating a "marketing efficiency score," which averages cost per MQL, MQL rate, and CAC payback, displayed as red, yellow, or green. Executives grasp the summary in two seconds, long before diving into the underlying metrics.
Decks need a shape, not a rigid template. Start with a single slide that matches the main result to the company target. Next, show the funnel, highlighting where content is converting and where it's getting stuck. Point out risk, like a leading indicator, pipeline coverage, or a velocity change, that warns of problems two quarters ahead. End with a clear request for a specific resource or decision, based on the evidence presented, instead of a general plea for "more support."
WordPress VIP's 2024 data shows 60% of C-executives think keeping and expanding current customers matters most for boosting revenue with content. Focus content's contribution on that priority for leaders, not on assets published this quarter.
The financial case for content that boards rarely hear made clearly
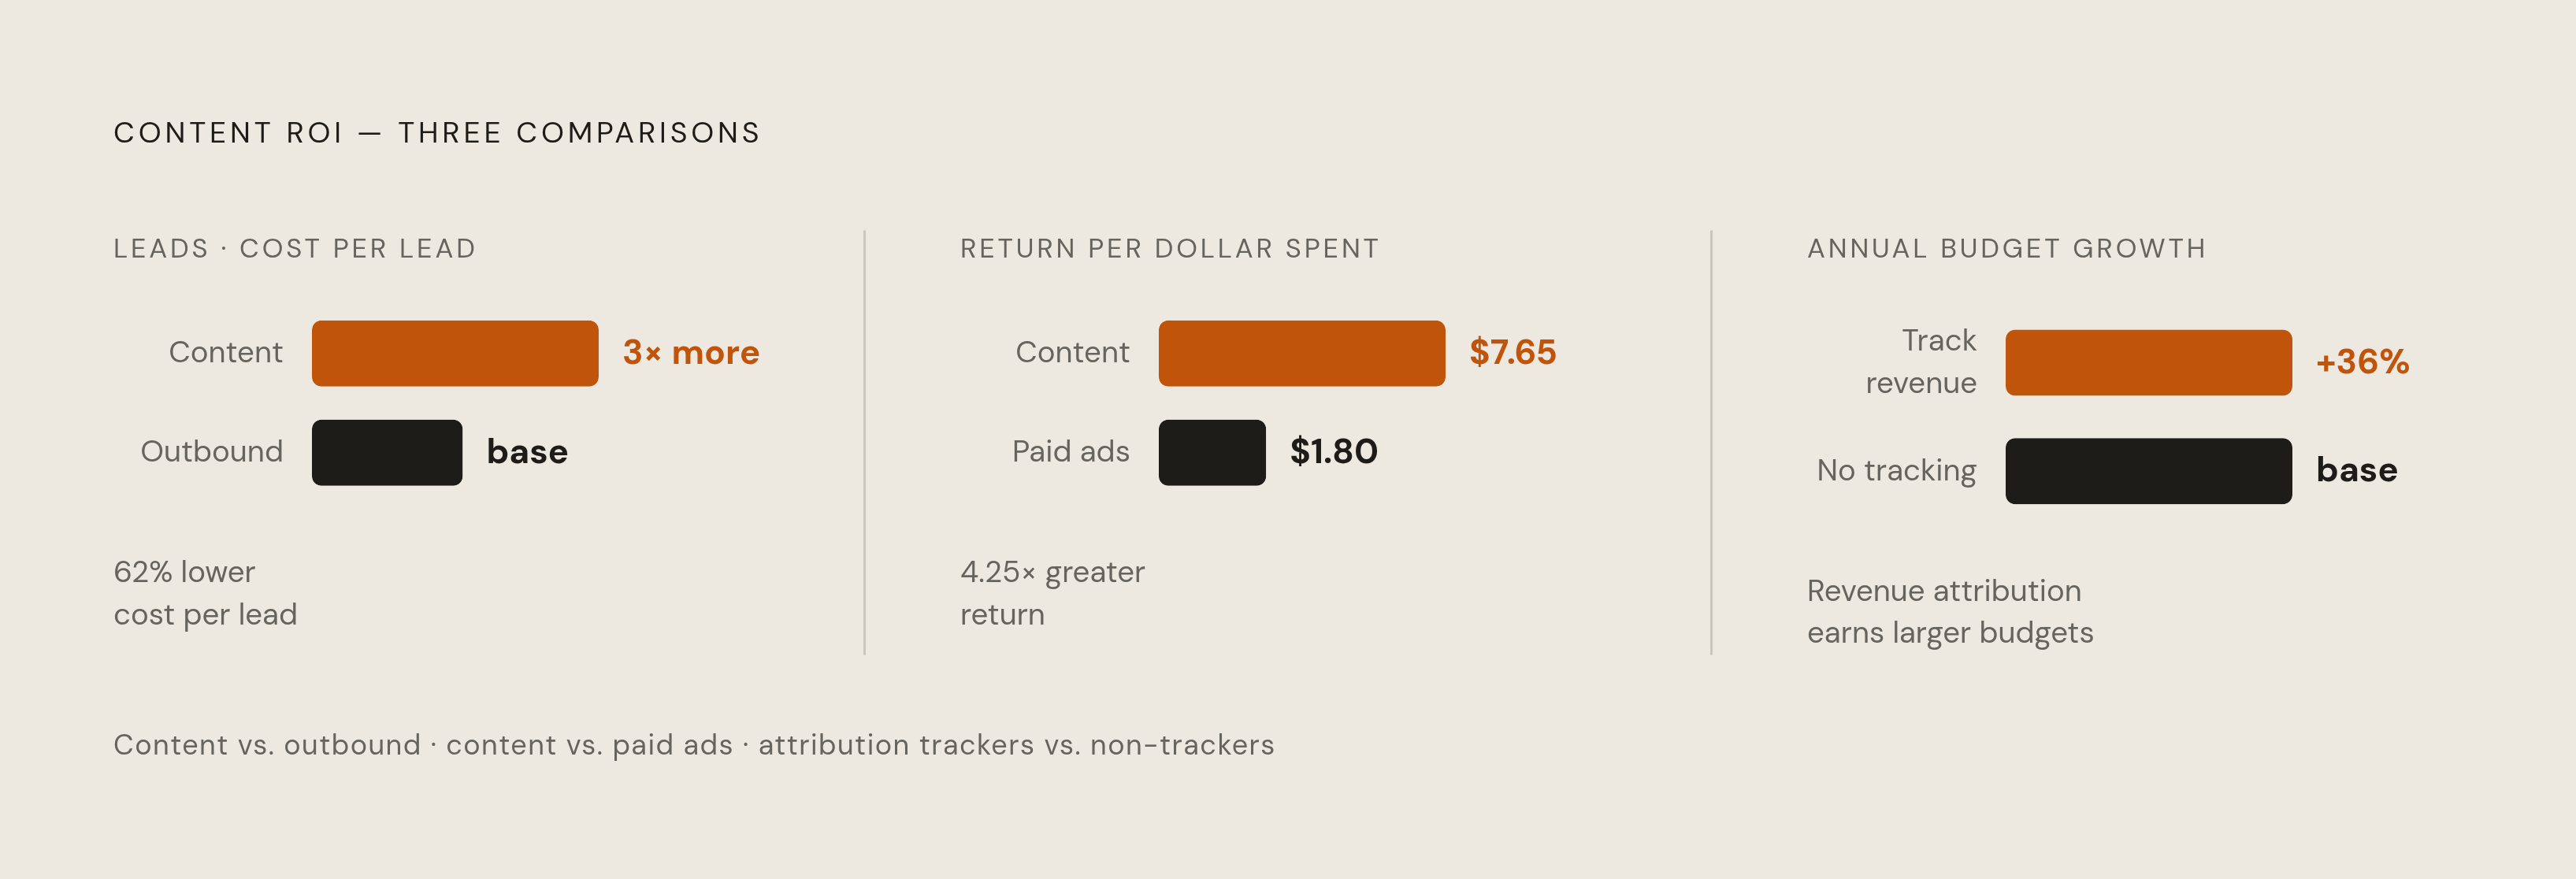
Demand Metric and CMI say content marketing gets three times as many leads as outbound, at 62% lower cost per lead, a figure most boards haven't seen. That's not a marginal efficiency gain. It's a completely different way to spend money, and boards rarely see this in their reports because marketers haven't made the financial case.
On average, Content spend has been reported to return $7.65 for every dollar, compared to $1.80 for paid ads. In B2B, a 3:1 content ROI is a strong benchmark, with top performers achieving 4:1 or more. Share that figure with the board, then inquire about the program's standing.
Measuring becomes a self-reinforcing cycle. Investing in content measurement infrastructure helps companies gain 36% larger content marketing budgets annually, as showing returns unlocks funds to create more content. Look at the gap between winners and losers: 60% of top B2B content teams track ROI, while only 28% of the worst do.
The budget allocation figures tell the same story financially. B2B companies vary widely in how much of their marketing budget they allocate to content. A company's standing on that range is more than just an accounting detail. It's a calculated decision on where growth really comes from, and most boards never see it framed that way.
Without spending, paid media yields nothing. It still earns for six to eighteen months once it’s live. Boards treating content as a regular expense are mispricing it: it's an asset that should be funded accordingly.
What attribution infrastructure actually needs to look like
Choosing an attribution model isn’t just a technical detail to leave to the person running the marketing automation platform. Choosing the right model is a CMO's key responsibility, as it directly decides which channels are credited, cut, or funded in the next budget.
Multi-touch attribution assigns credit to all touchpoints in a buyer's journey, not just the final channel. That approach fits content best, because content almost never drives a conversion by itself. It appears early or midway, is shared, and shapes decisions, yet it's never the final click.
It’s the content scoring system that ties a reader today to a sale down the road. Prioritize engagement depth, measuring it by scroll percentage, time on page, and repeat visits. Next, include conversion assists by tracking which content was viewed just before a demo request or MQL conversion occurred. Only attribute direct revenue where the data clearly supports it, without overstepping its limits.
None of that scoring works without the plumbing underneath it: CRM integration that ties every content touchpoint back to a contact record, UTM discipline applied consistently across every distribution channel, and one shared definition, agreed across marketing and sales, of what actually counts as a content-influenced opportunity. Without that groundwork, "pipeline influenced" can't be verified, which is worse than admitting the figure isn't there. Fake numbers hurt a CMO's reputation more than a missed quarter, since a missed quarter can at least be explained.
Planning must come first, not the tools. You must settle on the model and definitions before building a dashboard, not as you're building it, and not afterwards. A dashboard based on incorrect definitions only creates reports that seem certain but measure the wrong thing accurately, and that confidence is what makes a bad number risky.
What changes when reporting shifts from activity update to strategic input
The room's dynamic changes when content reporting aligns with the board's key metrics: key metrics like revenue attribution. The conversation stops being "justify this spend" and turns into "where should more of it go." That's a change in what marketing gets to be in that meeting, not just a change in tone.
Budget compression makes this practical, not academic. Marketing chiefs, with budgets at 7.7% of revenue, have no real standing if they can’t link what they do to the money. Those who make the connection are viewed as growth partners, a role that comes with a higher level of trust.
Boards are now being judged by tougher standards. The latest PwC and The Conference Board survey shows just 35% of executives rate their boards as excellent or good, indicating boards face their own performance pressures, which directly shape their expectations of management. A CMO bringing pipeline coverage data, a real attribution model, and a clear efficiency score isn't just submitting a report. It's a plan for growth, backed by solid data.
Then the flywheel effect builds: good reporting gets budget, that budget funds improved content and measurement systems, which then generate further good reporting. Teams that focus on measurable outcomes often see stronger results.
The first step for a marketing head isn’t picking dashboard tools. You must talk to the CFO and CEO to agree on what "content performance" means financially before picking any metrics. AI-assisted content platforms, including strategy-first tools that link editorial work straight to metrics, are more often how teams create that setup without starting a new analytics team. Speed and accuracy in measurement once seemed mutually exclusive. The compromise vanishes when the workflow includes both elements right from the start.